processOverview.README
Institute for Systems Biology
(c) Trey Ideker, October 2000
This document describes the software used at
the Institute for Systems Biology
to
process and analyze gene expression data from
DNA microarrays. This
description assumes
prior familiarity with current DNA microarray
technology.
For an introduction to using
microarrays, please refer to
[http://www.gene-chips.com]
or to
[www.cs.washington.edu/homes/jbuhler/research/array].
The microarray analysis process can be generally divided into a sequence of
three steps. All output files resulting from each step are space- or
tab-delimited text, allowing straightforward import into a spreadsheet
application such as Microsoft Excel. A full description and list of options for
each program is provided in separate README files. Options may also be listed
by typing the program name with no arguments on the command line.
 |
| STEP 1: Dapple to preprocess |
 |
| STEP 2: mergeReps to (optionally) VERA and SAM |
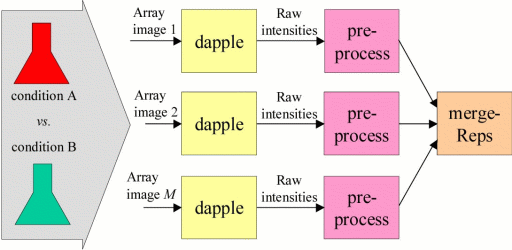
STEP 1
A basic microarray experiment determines expression-level intensities for N
genes in each of two conditions (conditions i vs. ii). This experiment produces
an image of a hybridized microarray which is converted into intensities for each
gene using the following programs:
Dapple      Locates and quantitates DNA spots in image, outputs raw intensity
            data.

preprocess  Performs background subtraction, normalization, and gene lookup on
            raw intensity data. Also provides rudimentary gene expression
            ratio for each gene (condition i/ii).


 [image file] -> Dapple -> preprocess -> [processed file]
STEP 2
The microarray experiment may be replicated M times, yielding M processed data
files as a result. A few (approx. 3 to 6) replicate experiments are highly
useful because they provide information on the error associated with the
measured intensities for each gene.
When available, replicate measurements are merged into one 'merge file.' If
desired, this file may be additionally analyzed to estimate the amount of
error/variability that has influenced the microarray experiment and to determine
which genes are expressed differentially between the two conditions i
vs. ii. Thus as detailed below, mergeReps is required, but VERA and SAM are
optional (although highly desirable in most cases).
mergeReps  Combines data from multiple preprocessed files and computes the
            average expression ratio (condition i/ii) of each gene over the
            replicate measurements.

VERA       [Variability and ERror Assessment] Estimates error model parameters
            from replicated, preprocessed experiments.

SAM        [Significance of Array Measurement] Uses error model to improve
            the accuracy of the expression ratio and to assign a value 'lambda'
            to each gene, indicating the likelihood that the gene is
            differentially expressed between conditions i and ii.


 [processed file 1] }
 [processed file 2] }
 [processed file 3] } -> mergeReps -> VERA -> SAM -> [merge file]
  ...               }              ---------------->
 [processed file M] }
STEP 3
One may perform microarray experiments corresponding to other condition
comparisons (iii vs. iv, v vs. vi, etc) for a total of C separate condition
comparisons and associated merge files. If desired, these multiple condition
comparisons may be merged into a single text file containing a matrix of
expression ratios for the N genes on the microarray (rows) over the C conditions
assayed (columns):
mergeConds  Creates gene expression matrix from multiple conditions


 [merge file 1] }
 [merge file 2] }
 [merge file 3] } -> mergeConds -> [expression matrix file]
  ...           }
 [merge file C] }


